![]()
![]()
![]()
3.1.1 Existing loss-assessment methods
3.1.2 Development of a new loss-assessment method [MM]
3.1.3 Experimental design
3.1.4 Qualitative analysis
3.1.5 Statistical analysis
3.1.1.1 Gravimetric Method [GM]
3.1.1.2 Volumetric/Gravimetric Method [VGM]
3.1.1.3 Visual Damage Scale Method [VDSM]
During a one-year test phase in the Institute for Stored Product Protection of the Federal Biological Research Centre for Agriculture and Forestry (BBA) and the Faculty of Agriculture and Horticulture, Humboldt University, in Berlin, the four loss-assessment methods listed below were evaluated and compared for limitations and suitability to assess post-harvest losses.
a) Gravimetric method (GM) (percentage weight loss)
(M. Wright, 1993)
b) Volumetric/gravimetric method (VGM) (density in g/cm3)
(M. Wright, 1991)
c) Visual damage scale method (VDSM) (five damage scales)
(J. Compton, 1991)
d) Manometric method (MM) (frass loss in ml relative air)
(Stumpf et al., 1994)
The experiments provided a base for further field experiments in Ghana at small-scale farm households.
This method has been tested for cassava by surveying in various locations throughout Africa and Asia (Wright et al., 1993 and Wright, 1995). The method is based simply on the comparison of the weights of infested and uninfested dried cassava chips. The result is determined in terms of percentage weight loss:

A = weight (g) of cassava chips after insect infestation
B = weight (g) of cassava chips prior to infestation
The assessment of the moisture content (m.c.) of each cassava-chip is a prerequisite to calculate the dry weight loss. In most cases, a sample of chips is selected for the determination of the average moisture content. This could lead to a slight over- or underestimation of weight loss (%) for each chip. The GM is easy to perform and leads to fairly precise measuring of weight losses. The precision and reliability of the method was the reason for using it as a reference method in this study and comparing it with other methods. Because it requires baseline data on uninfested chips to be related later to the data on infested ones, this method is quite time- and labour-consuming.
Wright (1991) found throughout his trials in Togo that there was a good and relatively constant relationship between the weight of an individual dry cassava chip and its outer volume of about 0.9, but a figure for the standard deviation was not mentioned by Wright. This suggests that for a given variety of cassava chips the magnitude of loss can be expressed in terms of volume. The cassava chips were weighed and their volume measured by displacing water in a scaled vessel. The relationship can be drawn as a graph or simply expressed as:
A = weight of a dried cassava chip (g)
B = outer volume of a dried chip (ml)
By multiplying the outer volume of a dried cassava-chip with the estimated density figure of 0.9, the predicted weight for that volume can be calculated. By use of a calibration curve in a graph, the outer volume of a dried chip can be estimated, and the difference in observed weight and predicted weight represents the weight loss of a cassava chip. Measurements and experience with the VGM are fairly new and associated with difficulties which include instability of the relationship of weight to outer volume of a dry cassava chip. With increasing infestation levels the outer volume changes disproportionally, which renders the prediction of the weight of a chip very difficult (personal comment, M. Wright, 1993). Moreover, the weight of a cassava chip could rarely be correctly predicted during our tests under laboratory conditions by assessing the outer volume of an infested chip. And the standard deviation was fairly high with sd = 0.7. This is related to the heterogeneous nature of the chip and its texture. The time-consuming aspect of assessing the outer volume of a dried chip makes this method quite tedious and not applicable for rapid assessments.
The methods of assessing the damage by visual damage scales was used by Compton (1991) in Togo. Damage scales are well known from pre-harvest assessments of crops for relation to pest damages. Compton developed a method which is simple, quick and does not require baseline data but is much less precise than the previously described GM. The outer appearance of the chips are the main criterion for the classification of chips into five damage scales (see Figure 13).
Figure 13: Visual damage scales (1 - 5) (VDSM) of dried cassava chips
|
|
I = undamaged (0 holes/cm2) |
|
|
II = light damage (up to 2 holes/cm2) |
|
|
III = medium damage (2 - 7 holes/cm2) |
|
|
IV = medium-high damage (4 - 9 holes/cm2), and light physical destruction of the cassava chip surface |
|
|
V= severe damage and the chip surface is physically destroyed so that bored holes are no longer countable |
The determination of the average number of holes/cm: is a supplementary factor for classifying chips into different damage scales. The chip surface will be divided in small sections prior to counting the boreholes. This technique requires experience in the classification procedure and is in use for many crops but is rather subjective. The respective damage scales can be calibrated by using the GM or any other method to assess weight losses related to a certain apparent damage of a cassava chip. Compton et al., (1993) calibrated the damage scales against measured weight loss from a survey in Togo (see Table 5). The VDSM revealed that cassava chips in scale II sustained weight losses of about 16%, chips classified in scale III about 29%, chips classified in scale IV about 42% and chips classified in scale V about 50%. The data in Table 5 illustrate also the enormous range of weight losses for one damage scale.
Table 5: VDSM of dried cassava chips calibrated for a field survey in Togo by Compton et al. (1993)
|
|
Visual damage scales |
|||
|
II |
III |
IV |
V |
|
|
Sample size (n) |
50 |
110 |
66 |
4 |
|
Mean weight lass in % |
15.8 |
29.3 |
42.0 |
49.7 |
|
Minimum weight loss in % |
5.2 |
12.2 |
23.9 |
44.5 |
|
Maximum weight loss in % |
29.7 |
51.9 |
70.7 |
55.0 |
n = number of dried cassava chips
The MM was developed in the laboratory in Berlin due to the limitations of other loss-assessment methods. The idea and technical design is a co-production of Stumpf (1994) and the BENTERT company. The newly developed loss assessment method is capable of determining the frass activity of beetles tunnelling through the dried chips. Major pests of cassava chips are known to bore holes into the dried root piece. This tunnelling activity increases the inner volume of a dried cassava chip. The increase in inner volume of a cassava chip is measurable by means of vacuum equipment (see Figure 14) and can be converted into weight loss.
Figure 14: Apparatus for the newly developed manometric method (MM) to assess weight losses of dried cassava chips
Technical device and measurement procedure
The measurement procedure is as follows (see Figure 14). The dry cassava chip is hung inside the funnel (1) and the funnel with the dried chip is then placed into a plastic jar (2) which is filled with water. The water is sucked into the measurement pile (3) thereby displacing air in the pile. A backstroke valve in the measurement pile has to ensure that the system is closed. When the vacuum pump (4) is started the air in the frass tunnels is expanded and extracted from the boreholes into the measuring cylinder where it displaces the water. This process is maintained until the inner volume of the cassava chip no longer expands (about 1 minute). When the vacuum pump is switched off, air flows back into the system and normal pressure returns to the system. The inner volume of the cassava-chip can immediately be read on the measuring pile in ml and this indicates the amount of a cassava chip consumed by the insects. A safety device (5) has to be connected between the vacuum pump and the plexiglass jar because of the high pressure and possible backflush of water. It is impossible to retrieve all the air from inside the boreholes and, hence, the measured value must be multiplied by a correction figure (K), which is determined through the calibration of the vacuum equipment. The calibration procedure is explained in the following chapter. In addition, an overestimation of insect feeding holes is likely because air is retrieved from boreholes as well as natural cracks on the whole cassava chip. A baseline study was established for uninfested cassava chips and it was revealed that chips of the variety "SORAD" contained about 7.4 ml air per 100 g weight of a cassava chip. This amount of air has to be deducted from the measurement for dried infested cassava chips to calculate the real weight loss of an infested cassava chip. During the intensive field survey in Ghana, the baseline assessment for each individual uninfested cassava chip revealed about 14 ml air for 100 g cassava chips.
Calibration
To ensure that a correct value for the volumes of the feeding holes of cassava chips are determined, a calibration of the equipment is necessary. A pre-condition for this measurement procedure is that the reduced pressure applied is reproducible for each measurement. For this purpose, the air in the Plexiglas measurement pile (3) is reduced by sucking water up to 3/4 of the length of the pile (e.g. 10 ml). This volume is noted as V1 and is expanded when applying reduced pressure. The air is expanded until no more expansion is detectable. This volume is noted as V2 (e.g. 40 ml). Both values are then recorded and fitted into the following expression and the correction factor (K) is multiplied with each value measured to determine of frass loss in a cassava chip by the use of the vacuum equipment:
|
|
K = V2/(V2-V1) |
|
e.g. |
K = 40/(40 -10) |
|
|
K = 1.333 |
Weight loss per g for a chip is expressed by applying the density factor of about 0.9 with the corrected value (see section 3.1.1.2). The great advantage of this method is its potential for use during the storage season without labour- and time-consuming assessments of baseline data.
Pre-testing of the newly developed method
The vacuum equipment was pre-tested for its sensitivity in the measurement of increasing frass activities of insects in terms of increase in inner volume. Cassava-chips were artificially damaged by drilling holes of approximately 2 cm depth and about 2 mm diameter into the chips by use of a boring machine. Weight losses were assessed by using the increase in inner volume (ml air) before and after drilling the holes. The drilling of holes had to be terminated after about 25 boreholes because the chips tended to break into pieces and further measurements would not have been possible.
Cassava chips of the sweet variety "SORAD" were obtained from Togo with the help of the sub-regional GTZ Post-Harvest Project in Lomé, Togo. The chips were collected at market places in Aouoka and Ayengre in the Central Region of Togo. Cassava material was collected in Togo where the field studies should have taken place, though the field studies were later carried out in Ghana due to political instability in Togo. Possible insect infestation on arrival in Berlin was anticipated, and all chips were placed in a deep freezer at a constant temperature of about -18° C for about four weeks to kill all insects. Cassava chips' exposure to insects and losses due to insect feeding were assessed with the four different loss assessment methods and the data translated into weight losses (%). Allowances were made for changes due to moisture content of cassava-chips.
The major cause of post-harvest losses during chip storage is infestation by insects. A wide range of species that feed directly on the dried chips have been reported as causes of weight loss in the stored produce. Some of the important species are: Rhyzopertha dominica (Fabricius), Araecerus fasciculatus (Degeer), Ahasverus advena (Waltl), Stegobium paniceum (Linnaeus), Tribolium castaneum (Herbst), Dinoderus minutus (Fabricius) and Prostephanus truncatus (Horn) (Pingale et al., 1956; Ingram and Humphries, 1972; Parker et al., 1979; Hodges et al., 1985; Balagopolan et al., 1988; Katere and Giga, 1990). Preliminary investigations had shown that P. truncatus is able to feed and multiply on cassava chips (Nyakunga, 1982; Magoma, 1988; Marshed-Kharusy, 1990). Heterobostrychus brunneus (Murray) and Sinoxylon sp. (Duftschmid) are known as material pests but were also mentioned in the literature as pests of dried cassava chips (Frappa, 1938; Lepesme, 1944; Mangoendihardjo, 1981; Dobie et al., 1991 and Delobel, 1992).
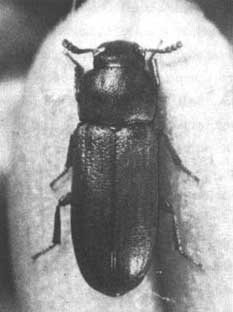
The investigations under controlled conditions took place independent from the field trials held later on in Ghana. Three insect species of the Bostrichidae family were chosen for the experiments under controlled conditions: the Lesser Grain Borer, Rhyzopertha dominica (Fabricius); the Larger Grain Borer, Prostephanus truncatus (Horn), a Tanzanian strain; and the Wood Borer Dinoderus bifoveolatus (Wollaston) (see Figure 15). It is known that the larvae and adults of Bostrichids have powerful mandibles with which they chew into and damage hard food and also dried cassava chips. "The shape of the Bostrichids is rather uniform and typical of boring beetles. The body is cylindrical and the head is ventral to the prothorax, i.e. deflexed" (Haines, 1991).
Rhyzopertha dominica (Fabricius) - Lesser grain borer
The adults and larvae of R. dominica are capable of boring into and feeding on a wide range of food commodities. R. dominica is one of the major pests of stored cereals and food products (see Figure 15). The adult is 2 - 3 mm long and in form is typical of the Bostrichidae. The females prefer to lay their eggs on the surface of or among the produce. On emergence, the larvae will make use of even minute husk defects to bore into the grain. Larval development occurs more rapidly on whole grains than on flours. The optimum conditions for the development of egg, larval and pupal stages are provided at a temperature of 34° C and a relative humidity of about 50% to 70%. R. dominica is exceptional in being able to develop on food of a very low moisture content, i.e. as low as 9%. Adults and larvae generally spend most of their time in tunnels in the grain or dried cassava chip. The numbers of eggs laid at 25° C average 244 per female, rising to an average of 418 at 34° C. Development of the larva through to adult stage at the optimum conditions can take only 22 days (Haines, 1991).
Dinoderus bifoveolatus (Wollaston) - West African ghoon beetle
Dinoderus sp. resembles both Rhyzopertha and Prostephanus but there are two prominent distinguishing features: (1) in most species there is a pair of slight depressions at the base of the pronotum, and (2) the scutellum is transverse, being about twice as wide as it is long (see Figure 15). Several species, D. minutus (Fabricius), D. bifoveolatus (Wollaston), D. distinctus (Lesne), D. ocellaris (Stephens) and D. brevis (Horn), infest dried cassava, bamboo and wood. D. minutus and D. bifoveolatus are encountered throughout the tropics. (Haines, 1991).
Prostephanus truncatus (Horn) - Larger grain borer
Like R. dominica the adults have the typical cylindrical bostrichid shape and are 3 - 4.5 mm long (see Figure 15). The species is indigenous in Central America, tropical South America, and the extreme south of the USA as a localised pest of farm-stored maize. In the late 1970's it was introduced to East and West Africa and became a serious pest of stored maize and dried cassava. The adults bore into the produce and cause high losses as they tunnel from grain to grain or into the chips. Adult females lay eggs in chambers bored at right angles to the main tunnels. Optimum development from larvae to adult takes place at about 32° C and 80% relative humidity, and over only 27 days on a maize grain diet. P. truncatus is tolerant of dry storage conditions, even up to 9% where other species such as Sitophilus sp. are not able to develop. Thus in dry conditions P. truncatus probably benefits from the absence of any significant competition from other storage pests. Under ideal conditions, the intrinsic rate of increase ® of P. truncatus is in the order of 0.7 -0.8/week. This is similar to the rate of increase reported for Tribolium castaneum (Herbst) under comparable physical conditions (Haines, 1991).
Tribolium castaneum (Herbst) - Red flour beetle
Tribolium castaneum (Herbst) which belongs to the Tenebrionidae family, was chosen as an important secondary pest of stored produce (see Figure 16). The Tenebrionidae are common throughout the temperate and tropical regions of the world. Tribolium castaneum is capable of living on a wide range of durable commodities and is considered to be a secondary pest, being unable to attack undamaged produce. The species is not well adapted to dry situations and, hence, depend upon the presence of moulds or moist foodstuffs. Therefore, the occurrence of this pest is an indicator of inadequate storage hygiene. Like most other storage beetles, Tribolium castaneum can penetrate deeply into the stored commodity. Optimum conditions for the development of these species are 35° C and 75% relative humidity. The adults are typically tenebrionid in shape, 2.3 - 4.4 mm in length and red-brown in colour. The females lay rather sticky eggs in the commodity throughout their adults lives and under optimal conditions, development from egg to adult may take only 20 days. Adults can live for about six months. Cannibalism and predation play an important role in the nutrition of T. castaneum. The eggs and pupae are often cannibalised by the adults, the males showing a preference for pupae and the females for eggs.
The experimental design comprised a randomised complete block, with at least four replicates for each insect combination. Only those cassava chips (13% m. c.) without any boreholes were weighed in quantities of 100 g chips into 750 ml glasses. The glasses, sealed with plastic lids and fixed with wire screens in the middle, were transferred to climate chambers. Prior to the start of the experiments, cassava chips and stock insects used in the experiments were separately preconditioned to two constant temperatures, 28° C and 33° C, and 70±5% relative humidity (r.h.) for about two to three weeks and subsequently maintained under these conditions. Stock insects were reared in culture jars by introducing the insect species to dried chips and cassava flour. The temperatures and relative humidity were monitored by a thermohygrograph. Insects exposed to chips in the experiments were one to four weeks old and in the adult stage. The start populations were high enough to ensure quite an even sex ratio (Detmers, 1990). Test insects were exposed to dried chips in at least five replicates per experiment.
Figure 16: Tribolium castaneum - Red flour beetle
For experiments with single populations of P. truncatus R. dominica D. bifoveolatus and T. castaneum or mixed populations of two different species (1) D. bifoveolatus + T. castaneum; (2) P. truncatus + D. bifoveolatus; (3) P. truncatus + R. dominica (4) P. truncatus + T. castaneum, start population densities of 12 or 24 insects were used. The trials with mixed insect populations were established to simulate the situation in the field where cassava chips are exposed to several insect species competing for feed and space (Ciesielska, 1975,1978,1985; Shazali and Smith, 1990).
Parameters investigated under controlled conditions included insect population development and percentage weight loss of dried cassava chips. Dried cassava chips were destructively examined for live insects and numbers of insects noted. It was difficult to count all insects because most of them were residing inside the chips. Therefore, the chips were exposed to oven temperatures of 100° C for about 20 - 30 minutes. The heat forced the insects out of the chips leaving them alive or dead in the glasses. Even though a few insects remained in the chip, most of them emerged and it was possible to give a fairly accurate count of the insect population development. The forcing out of insects in stored produce has been successfully used by Hashem (1989) in biological studies of the Larger Grain Borer, Prostephanus truncatus (Horn).
Qualitative assessment was carried out for HCN and starch content of the chips. Cassava flour prepared from infested and uninfested chips was analysed before and after the experiments. The chips were pounded into quantities of 100 g cassava flour, which was sealed airtight and sent off to the ECO SYS company in Germany for further analysis. The total cyanide and starch content was determined in the dried chips using a standard procedure:
Determination of cyanide
About 10 g of cassava flour and 2.5 g of sweet almond flour are mixed in water in the presence of a buffer solution, thus releasing the bound glycosidic cyanide acid. The cyanide acid is then distilled into a 0.1 N hydrochloric acid leach and after acidulation the cyanide acid is mixed with bromine water forming bromine cyanide. With pyridine and 2-aminobenzoe acid, a red colour is visible and the colour intensity is photometrically measured. The cyanide content is calibrated against a series of test samples which contain 2, 4, 6,10 and 12 m g HCN and are treated in the same way as the samples.
Starch determination
About 1 g of cassava flour is weighed into an Erlenmeyer flask, and 20 ml of dimethyl-sulforic-oxide and 5 ml hydrochloric acid (8 mol/l) are added to the flask. The flask is sealed with paraffin and shaken in a water bath at 60° C for about 30 minutes. After cooling down, about 50 ml water is added and the pH is adjusted between 4 and 5 with sodium carbonate leach. The mixture is transferred to a 100 ml measuring vessel and then filled up to the mark with water. For the enzymatic test (starch after Beohringer/Mannheim), 0.1 ml of the mixture is used.
Determination of moisture content (m. c.)
The moisture content (m. c.) of cassava chips was determined on a four-week basis for all samples by using a Brabender semi-automatic moisture tester and was based on six samples of 10 g for each trial. The samples were exposed in the Brabender oven for about 2 h at 130° C. The m. c. could be read immediately after the heating process. Adjustments to the climate conditions for three to four weeks prior to experimentation reduced the possibility of dramatic m. c. increases of dried chips during the experiments. To determine weight losses (%) only related to insect damage, all weight changes were related to the dry weight of chips.
The data were analysed using SAS computer programs to calculate correlations and regressions. Dunnett l-tests were carried out to determine the mean significant differences (p = 0.05).
3.2.1 Pre-testing of the newly developed MM
3.2.2 Experiments with loss assessment methods
3.2.3 Comparison of four different loss-assessment methods
3.2.4 Investigations of insect pest population dynamics
3.2.5 Investigations into qualitative losses of cassava chips
Testing of the loss assessment methods under controlled conditions provided the base for further experiments at small-scale farm-households in the Northern Region in Ghana.
The accuracy of the different weight loss assessment methods was examined by linear regression of the weight loss against the number of boreholes (see Figure 17). The GM was chosen as the standard method and the other two methods were compared against it. The gradient of the MM was close to the GM at 0.8. The MM loss curve in comparison to the GM loss curve slightly overestimates the losses per borehole. In contrast, the gradient of the VGM at 0.3 was different from the GM and MM and either grossly over- or underestimating the losses per borehole and measured losses on dried cassava chips without holes.
The correlation coefficient of the regression lines was also calculated, and the results of the different loss assessment methods plotted against the number of artificially drilled holes correlated positively with weight losses. The probability that an individual value is within the 95% confidence limits is about r = 0.9 for losses assessed with the GM and MM and r = 0.3 for those assessed by the VGM. The relationships (see Figure 17) between loss-assessment methods and number of boreholes are expressed as follows:
GM = -0.004 + 0.09 x
VGM = 1.15 + 0.05 x
MM = 0.19 + 0.11 x
It was noted that all methods differed significantly from each other in their mean estimation of weight losses per borehole (see Tables 6 and 7).
Table 6: Comparison of weight losses (%) on quantities of 100 g infested cassava chips assessed by the GM and VGM (n = 54 cassava chips, 3 replicates)
|
GM |
VGM |
t-test |
||
|
mean |
sd |
mean |
sd |
|
|
1.2 |
0.72 |
1.7 |
1.28 |
s |
p = 0.05, 2 tailed significance; s = significant; n.s. = not significant
Table 7: Comparison of weight losses (%) on quantities of 100 g infested cassava chips assessed by the GM and MM (n = 54 cassava chips, 3 replicates)
|
GM |
MM |
t-test |
||
|
mean |
sd |
mean |
sd |
|
|
1.2 |
0.72 |
1.6 |
0.86 |
s |
p = 0.05, 2 tailed significance; s = significant; n.s. = not significant
Post-harvest losses of cassava chips under controlled conditions increased with exposure to insects. Figure 18 illustrates that the loss assessed with the GM and MM followed the same trend as in the pre-test analysis, and that the measurements with the two methods were close in value. In contrast was the loss curve of the VGM, which did not closely follow the other two loss assessment methods, especially at 12 weeks of storage.
Figure 18: Development of loss curves assessed with 3 different methods on quantities of 100 g infested cassava chips exposed to 4 different insect species, P. truncatus D. bifoveolatus, R. dominica and T. castaneum, at 33° C/70 ±5% r.h., 4, 8 and 12 weeks storage period (n = 40 chips, 5 replicates)
The VGM and MM were compared to the GM reference method. The results of the MM and VGM in the experiments with chips exposed to four different insect species under controlled conditions revealed that weight losses occurred even at the beginning of the storage period and with no boreholes. After four and twelve weeks of exposure to four different insect species, the results produced by the VGM differed significantly from those of the reference method and MM (see Tables 8 and 9).
Table 8: Comparison of weight losses % assessed by GM and VGM and on quantities of 100 g infested cassava chips exposed to 4 different insects species, P. truncatus, D. bifoveolatus, R. dominica and T. castaneum, 4, 8 and 12 weeks storage period (n = 40 chips, 5 replicates)
|
weeks after storage |
GM |
VGM |
t-test |
||
|
mean |
sd |
mean |
sd |
||
|
0 |
0 |
0 |
0.6 |
3.60 |
n.s. |
|
4 |
1.6 |
1.24 |
3.1 |
4.01 |
s |
|
8 |
3.5 |
1.97 |
3.8 |
3.52 |
n.s. |
|
12 |
9.3 |
4.51 |
4.9 |
3.16 |
s |
*p = 0.05, 2 tailed significance; s = significant, n.s. = not significant
The comparison of losses assessed with the GM and MM revealed no significant differences in the values of weight losses. The MM assessed small weight losses on chips which were not visibly damaged (see Table 9).
Table 9: Comparison of weight losses % assessed by the GM and MM and on quantities of 100 g infested cassava chips exposed to 4 different insects species, P. truncatus D. bifoveolatus, R. dominica and T. castaneum, 4, 8 and 12 weeks storage period (n = 40 chips, 5 replicates)
|
weeks after storage |
GM |
VGM |
t-test |
||
|
mean |
sd |
mean |
sd |
||
|
0 |
0 |
0 |
0.1 |
0.05 |
n.s. |
|
4 |
1.6 |
1.24 |
1.9 |
1.25 |
n.s. |
|
8 |
3.5 |
1.97 |
4.2 |
2.14 |
n.s. |
|
12 |
9.3 |
4.51 |
8.0 |
3.46 |
n.s. |
*p = 0,05, 2 tailed significance; s = significant, n.s. = not significant
The correlation of the values between the GM and MM was very close, and the probability for the means of weight losses to be within the 95% confidence limits was r = 0.9 (see Figure 19). By contrast, the correlation of the reference method with the VGM is r = 0.5, and some results were even negative (Figure 20). These results are similar to those of the pre-tests in section 3.2.1, where the correlation of the VGM with the GM is only r = 0.3.
Figure 19: Relationship of weight losses assessed by the GM and MM for cassava chips exposed to 4 different insect species, P. truncatus D. bifoveolatus, R. dominica and T. castaneum, 4, 8 and 12 weeks storage period (n = 40 chips)

Figure 20: Relationship of weight losses assessed by the GM and VGM for cassava chips exposed to 4 different insect species, P. truncatus D. bifoveolatus, R. dominica and T. castaneum, 4, 8 and 12 weeks storage period (n = 40 chips)
Furthermore, each loss assessment method was related to the number of boreholes. It can be observed in Figures 21 and 22 that the probability for an individual value to be within the 95% confidence limits is highest for the GM and MM with r = 0.9. In addition, the slope of both regression lines is similar. Conversely, when the relationship of boreholes-to-weight loss is assessed with the VGM and r = 0.4, the gradient of the curve differs from those of the GM and MM (see Figure 23). All these results are in line with the data collected in the pre-tests, where the relationship VGM with boreholes is r = 0.3, whereas the relationship GM and MM with boreholes is r = 0.9.
Figure 21: Relationship between weight losses assessed by the GM and number of boreholes for chips being exposed to 4 different insect species, P. truncatus D. bifoveolatus, R. dominica and T. castaneum, 4, 8 and 12 weeks storage period (n = 40 chips)
Figure 22: Relationship between weight losses assessed by the MM and number of boreholes for chips being exposed to 4 different insect species, P. truncatus D. bifoveolatus, R. dominica and T. castaneum, 4, 8 and 12 weeks storage period (n = 40 chips)
Figure 23: Relationship between weight losses assessed by the VGM and number of boreholes for chips being exposed to 4 different insect species, P. truncatus, D. bifoveolatus, R. dominica and T. castaneum, 4, 8 and 12 weeks storage period (n = 40 chips)
Visual Damage Scale Method VDSM
Cassava chips were classified in damage scales according to the number of boreholes per chip or cm, of the chip surface, with higher borehole concentrations corresponding to higher damage scales. Damage scales were calibrated with the three described loss assessment methods. Since chips were mainly classified into damage scales I, II and III, no data are available for damage scales IV and V in the experiments for cassava chips exposed to the four different insect species. Table 10 represents weight losses for the different damage scales, which ranged from 0-0.1% for scale I, from 3.6 - 4.3% for scale II and from 6.3 -10% for scale III.
Table 10: VDSM calibrated with 3 different loss assessment methods for experiments under controlled conditions and chips exposed to 4 different insect species P. truncatus D. bifoveolatus, R. dominica and T. castaneum, start population of 6 insects per species; 4, 8 and 12 weeks storage period (n = 60 chips)
|
|
VDSM |
||||
|
I |
II |
III |
IV |
V |
|
|
GM (mean in %) |
0 |
3.6 |
10.0 |
- |
- |
|
sd |
0 |
2.8 |
5.6 |
- |
- |
|
VGM (mean in %) |
0.0 |
4.1 |
6.3 |
- |
- |
|
sd |
3.7 |
3.0 |
2.2 |
- |
- |
|
MM (mean in % |
0.1 |
4.3 |
10.0 |
- |
- |
|
sd |
0 |
2.9 |
4.0 |
- |
- |
- = no data available
Table 11 illustrates the results of all the different experiments on cassava chips exposed to single and mixed insect species. Weight losses assessed for the different damage scales ranged from 0 - 0.4% for scale I, from 3.7 - 4.0% for scale II, and from 4.2 -15.0% for scale III. Results of 36.5% for scale IV and 59.3% for scale V were obtained. All figures depended on the loss assessment method chosen for the calibration. Cassava chips were classified in all damage scales; however, the assessment for scale IV and V was only possible with the GM due to difficulty in measuring severely damaged chips with the other methods and water-absorption by the chips which made volume measurements impossible.
Table 11: VDSM calibrated with 3 different loss assessment methods for experiments under controlled conditions and chips exposed to single and mixed insect infestation of P. truncatus D. bifoveolatus, R. dominica and T. castaneum, start population of 12 and 24 insects per species; 4, 8 and 12 weeks of storage (n = 300 chips)
|
|
VDSM |
||||
|
I |
II |
III |
IV |
V |
|
|
GM (mean in %) |
0 |
3.9 |
15.0 |
36.5 |
59.3 |
|
sd |
0 |
3.6 |
10.2 |
8.3 |
18.2 |
|
VGM (mean in %) |
0.4 |
3.7 |
4.2 |
- |
- |
|
sd |
1.8 |
1.8 |
2.0 |
- |
- |
|
MM (mean in % |
0.01 |
4.0 |
8.8 |
- |
- |
|
sd |
0.04 |
2.7 |
3.8 |
- |
- |
- = no data available or measurable
All damage scales showed wide variations of results dependent upon the loss-assessment method chosen for calibration. The variations for each damage scale are much higher for experiments with chips exposed to single insect species than to four different insect species (see Table 10 and 11). This may be due to the fact that chips exposed to single populations of P. truncatus yielded the highest weight losses.
The suitability, apparatus and costs of the four different loss assessment methods are critically reviewed in the following section based on both experience and experimental results in the laboratory (see Table 12).
Table 12: Comparison of four different loss assessment methods under controlled conditions related to certain criteria
|
Criteria |
Loss-assessment methods |
|||
|
GM |
VGM |
MM |
VDSM |
|
|
Suitability |
**** |
** |
**** |
*** |
|
Apparatus and costs |
** |
** |
** |
*** |
**** = very good, *** = good, ** = suitable, * = less suitable
Suitability
The accuracy of losses obtained by the four loss-assessment methods was quite variable. MM and GM were considered to be the most accurate methods under controlled conditions (see Table 12). Measuring losses with the GM required an accurate definition of the moisture content (m. c.) of cassava chips and baseline data of uninfested chips. In all cases, an average m. c. was determined, which may lead to a slight over- or underestimation of weight loss (%) for each chip. The great advantage of the MM is the non-usage of baseline data, but weight losses do become slightly overestimated. It scores as a very precise method and is closely related to the reference method with r = 0.9 in assessing post-harvest losses. The assessment of losses with VGM varied to a great extent and either grossly over- or underestimated the losses measured against the reference method with r = 0.3 to 0.5. With severely damaged cassava chips, it was difficult to estimate the losses accurately with the MM and VGM due to the hygroscopic nature of the chip: the damaged surface of the chip caused water to be sucked into the tissues of chips and measurements were rendered impossible.
When weight losses were plotted against the numbers of insect boreholes, correlations of about r = 0.9 were obtained for values assessed by the GM and MM, in comparison to r = 0.3 to 0.4 for values assessed by the VGM.
The assessment of infested chips with the VDSM depended on the visually and, therefore, subjective impression of the cassava chips and the classification into damage scales using drawings or photographs of each scale. Number of boreholes was used as a supporting aid. Wide variations of weight losses for each damage scale were estimated for calibration of the respective scale with quantitative methods.
Objective, verifiable loss figures have to be comparable to allow for comparison of loss values in different districts, regions or countries. The post-harvest weight losses assessed with the GM, the VGM and the MM are comparable in this respect, but the VDSM relies on the estimation of weight losses for each damage scale. The variation of weight losses for each scale renders comparisons with other surveys quite difficult.
Apparatus and costs
Usage of apparatus such as scales vacuum equipment is in many cases only possible in a laboratory, and the time-consuming transfer of chips to the experiment site is an important factor in selecting technical methods. Moreover, methods relying on apparati for assessment of losses are costly, whereas VDSM, requires only some good drawings or photographs of damage classes (see Table 12). However, calibration of damage scales requires the support of a technical loss-assessment method and its technical assets. The great advantage of VDSM is the possibility of immediate usage without any sophisticated technical equipment and the wide range of possible users such as farmers or traders in developing countries.
Experiments with single insect populations
The Bostrichids are described as the most important pest families of dried cassava chips. The insects bore holes into the chips and make many frass tunnels producing fine, flour-like dust. As in maize, the insects generally remain in the frass tunnels inside the chips. The population growth of these storage pests in the early stages of infestation is potentially exponential (Hodges et al., 1985; Okello, 1994). The Larger Grain Borer Prostephanus truncatus (Horn) as a single population caused the highest weight losses (%) compared to single populations of the Wood Borer Dinoderus bifoveolatus (Wollastan) or the Lesser Grain Borer Rhyzopertha dominica (Fabricius). At 28° C/70±5% r.h. and after eight weeks of storage, weight losses of cassava chips resulting from exposure to P. truncatus were between 39 - 50%, depending on the start population of insects on 100 g dried chips. The start population of 12 beetles increased to 273 beetles, while 24 insects increased to 287 beetles (see Figure 24).
At 33° C, P. truncatus caused weight losses of chips from 45 to 57%, after eight weeks of storage and depending on the start population of insects (see Figure 25). The insect numbers at 33° C (nearly optimum climatic conditions for P. truncatus (Shires, 1979)) and 12 or 24 insects as start populations, rose in the end of the storage period to 300 and 314 beetles, respectively.
It appears that with a smaller start population of 12 insects, in comparison to 24 insects, the development rate is less affected by competition for food and the frass activity of P. truncatus is much more pronounced (see Figure 24). On the contrary are the results shown in Figure 25, where the weight losses are much higher with a start population of 24 insects than of 12 insects. It may be concluded that intraspecific competition for the same amount of food and space depends also on the climatic conditions, and with higher temperatures and nearly optimum climatic conditions for P. truncatus the rate of development increases as well (Shazali 1985). But all individuals share limited resources under controlled conditions, and as a result reduced population stability may eventually occur (Giga and Canhao, 1993).
Weight losses for D. bifoveolatus measured about 6% at 28° C/70±5% r.h., and after 8 weeks a start population of 12 insects had increased to 32 beetles (see Figures 26). At climatic conditions of 33° C/70±5% r.h., D. bifoveolatus caused losses of about 2% with a start population of 12 insects, and after eight weeks of storage 15 beetles were counted (see Figure 26). In contrast R. dominica caused weight losses of about 1% with a start population of 12 insects growing to 41 after 8 weeks of storage (see Figures 27). The reproduction rate depends for both species on competitive and climatic factors.
Figure 27: Development of weight losses (%) assessed on quantities of 100 g cassava chips exposed to R. dominica and a start population of 12 insects and at 33° C/70±5% r.h.; 4, 8 and 12 weeks of storage

In summary, the enormous destructive potential of P. truncatus could be attributed to (1) its enormous frass potential and (2) its high development rate in comparison to the other insect species. (Adesuyi (1975), Hodges et al. (1985) and Wright et al. (1993)). In experiments with single insect populations at 28° C and start population of 12, D. bifoveolatus produced 32 beetles an P. truncatus produced 273 beetles after 8 weeks of exposure to chips. At 33° C and start populations of 12, P. truncatus produced 300 beetles compared to 15 D. bifoveolatus and 41 R. dominica beetles. Thus, P. truncatus produced from 8.5 to 20 times the quantities of D. bifoveolatus and 7.3 times the quantities of R. dominica In single experiments with T. castaneum, no development was measured; this could be due to the cannibalistic behaviour of this species and its dependence on already damaged chips as a secondary pest. Calculation of "infestation-level to damage" relationships for the experiments with single insect species exposed to 100 g cassava chips is difficult because intraspecific competition, mode of presentation of cassava (i.e., flour or chips) and climatic conditions are influential factors.
Experiments with mixed insect populations
Experiments with different insect species exposed to 100 g dried chips were set up in the laboratory because always a range of insect pests is found infesting dried chips in Africa. In experiments with two species (P. truncatus, and either R. dominica or D. bifoveolatus) and with a start population of 12 insects' per species P. truncatus accounted for 74% (105 beetles) and 76% (140 beetles) of the total number of beetles while R. dominica and D. bifoveolatus accounted for about 49 and 38 beetles respectively. Weight losses in experiments with chips exposed to combinations of P. truncatus and D. bifoveolatus measured 19% while P. truncatus and R. dominica brought results of about 26% after eight weeks of storage (see Figure 28). Chips exposed to Tribolium castaneum (Herbst) and P. truncatus at the same climatic conditions as the other experiments (28° C/70±5% r.h.), amounted to weight losses of about 37%, and P. truncatus accounted for 96% of the total population. Insect populations of D. bifoveolatus with T. castaneum caused weight losses of chips up to about 3% after eight weeks of infestation. The number of insects of both species was quite low in comparison with other experiments, with 15 D. bifoveolatus beetles and 12 T. castaneum beetles after eight weeks of storage.
In experiments with mixed populations, the development rate of P. truncatus was limited, with 105 and 140 beetles; this may be compared with the 273 beetles in experiments with single populations and the same climatic conditions. The reduced numbers of P. truncatus may be referred to as an effect of interspecific competition for food and space, whereas D. bifoveolatus competing for the same food and space was slightly positive influenced. P. truncatus was slightly less affected by competition in experiments with T. castaneum, and about 240 beetles were counted after eight weeks of storage. The red flour beetle T. castaneum, a secondary pest known to thrive on cassava chips, was also tested but its destructiveness towards cassava chips, in single or mixed insect populations, was not visible. In the literature, it has been mentioned that the beetle has a carnivorous behaviour which might hamper the development rates of other beetles. The development rate of D. bifoveolatus was low in mixed experiments with T. castaneum, with only 15 beetles compared to 38 beetles in experiments with other insect species. Competition among insect populations has been described for insect species by Ciesielska (1975, 1978), Shazali and Smith (1990), Giga and Canhao (1993).
Figure 28: Development of weight losses (%) assessed on quantities of 100 g cassava chips exposed to combinations of 2 different insect species and with a start population of 12 insects each species, 28° C/70±5% r.h.; 8 weeks of storage
1= D. bifoveolatus, + T. castaneum; 2=P. truncatus + D. bifoveolatus; 3= P. truncatus + R. dominica; 4= P. truncatus + T. castaneum
The starch content of the dried chips (variety "SORAD") decreased slightly by about 7%; the initial measurement of 72% decreased finally to 68%. Wright et al. (1993) reported that the nutritional quality of chips is less likely to decrease; instead, some nutritional variables might even be enhanced due to pest infestation. This is probably caused by the addition of protein to the damaged chips by cast skins and insect bodies which remain in the chips during the chemical analysis. Insect activities also create a moist microclimate within the infested chips, however, which might lead to increasing m. c. levels and to possible increase of insect pests and occurrence of mould infestation. Moreover, the chips are likely to decrease in consumption quality due to insect infestation.
Within the storage period, the HCN content decreased by about 57%. At the beginning, the chips (variety "SORAD") contained about 1.36 ppm in 100 g cassava flour and by the end, after 12 weeks of storage, about 0.78 ppm. This HCN content decrease could be partly attributed to the period of storage but also to the breaking up of chips and milling into flour, setting free the linamarase enzyme which reduced the HCN content (see chapter 2 for further explanations on the toxicity of cassava).
![]()
![]()
![]()


